Programming Environment
In this chapter we’ll spend a bit of time exploring the offering of IDE, debuggers and profilers available to you when making a 3D application. Unlike programming languages on the CPU that have a very broad offering of products to develop in lots of different languages, there are fewer GPU languages and even fewer IDEs that well support these languages.
Shading Languages
Shading languages are programming language specialized in writing GPU programs specialized for rendering. In a rendering engine, shading languages can be used to display 3D objects, do custom effects, perform object culling, simulate physics, etc.
If you’re interested about an overview of shading languages, I highly recommend reading A Review of Shader Languages by Alain Galvan.
HLSL
HLSL (High-Level Shader Language) is a shading language developed by Microsoft for use with Direct3D. It is designed to write efficient GPU programs for rendering, including vertex, pixel, and compute shaders. HLSL provides a C-like syntax with built-in functions and data types optimized for graphics processing. It is widely used in game engines and real-time applications because of it’s complete feature set and frequent updates following the advances of new DirectX features.
GLSL
GLSL (OpenGL Shading Language) is a high-level shading language specifically designed for use with the OpenGL graphics API. It also features a C-like syntax, however, compared to HLSL it has a more limited feature set and tends to lag behind in terms of adopting new functionalities.
To compensate for these limitations, GLSL often relies on extensions provided by GPU vendors or the Khronos Group. While this allows developers to access advanced features, it can make the ecosystem fragmented and inconsistent across different hardware. Despite these challenges, GLSL remains one of the most widely used shading languages, with an extensive collection of examples, tutorials, and community resources, making it an accessible choice for many graphics programmers.
MSL
Metal Shading Language (MSL) is Apple’s GPU programming language, designed for use with the Metal graphics API. Based on C++14, MSL provides a familiar syntax for developers while offering low-level access to GPU features. Because it is a proprietary language, it is exclusively used to make application on Apple devices. It also offers specific functionalities to optimize shaders and resource management on Apple hardware. MSL is currently the only supported shading language on Apple, which leads most of the cross-platform engines to implement a translation layer from another shading language to MSL.
WGSL
WGSL (WebGPU Shading Language) is a modern shading language designed for use with the WebGPU API, which provides access to the GPU in web browsers. WGSL is specifically built to replace OpenGL ES, offering more flexibility and new features. Compared to shading languages used natively on PC, it is more restricted due to the wide range of platforms a browser need to support.
Slang
Slang is a modern shading language designed to provide a flexible and high-performance environment for writing GPU programs. It combines features from traditional shading languages with advanced capabilities like type safety, introspection, and cross-platform support. Slang is particularly focused on simplifying the integration of shaders into complex graphics pipelines, offering a unified approach that works across different rendering backends. Its goal is to provide a more powerful and efficient alternative to existing shading languages while maintaining ease of use and flexibility.
HLSL Editors
While many popular editors offer basic support for HLSL or shaders through extensions, they often lack important features like reliable autocomplete, linting, or symbol parsing. Below is a list of IDEs that provide better support for HLSL:
| Editor | Extension |
|---|---|
| Visual Studio | HLSL Tools for Visual Studio |
| Visual Studio Code | HLSL Tools |
| Rider | Built-in |
| GPU Reshape | Built-in |
CPU side: C++ / Rust, gfx library
When constructing the back end of a renderer, a variety of high-quality libraries are available to support your application development. The choice of library often hinges on the graphics API abstraction level (such as OpenGL, DirectX, Vulkan) and the specific features you require. Each library offers different degrees of cross-platform compatibility, and many support multiple languages, including Rust, C++, C# and more through bindings.
Selecting the right library will depend on both the feature set you aim to implement and your comfort with graphics programming. Higher-level libraries generally provide greater ease of use by abstracting a part of the complexity, while low-level APIs, like DirectX12 or Vulkan, grant full control at the cost of increased complexity and a steeper learning curve.
For those new to graphics programming, I recommend beginning with a modern, high-level graphics library. This approach allows you to focus on foundational concepts without being overwhelmed by the demanding specifics of low-level graphics API management.
Here’s a list of the most famous ones: https://github.com/jslee02/awesome-graphics-libraries.
Debugging & Profiling
Most of the IDE doesn’t support debugging GPU code, this has to do with the fact that the GPU is a more closed and restricted programming environment. It is also impossible to put the execution of a shader on pause for debugging like breakpoints do for CPU code. Because of this external debuggers are used to debug and profile the GPU code, they provide different functionality to inspect the workload that has been submitted to the GPU during a frame and provide replay tools to analyze in detail what happened.
Note that most of the GPU debugging tools exist only on Windows, this is the platform that offers the most support for investigating real-time workloads and debugging.
RenderDoc
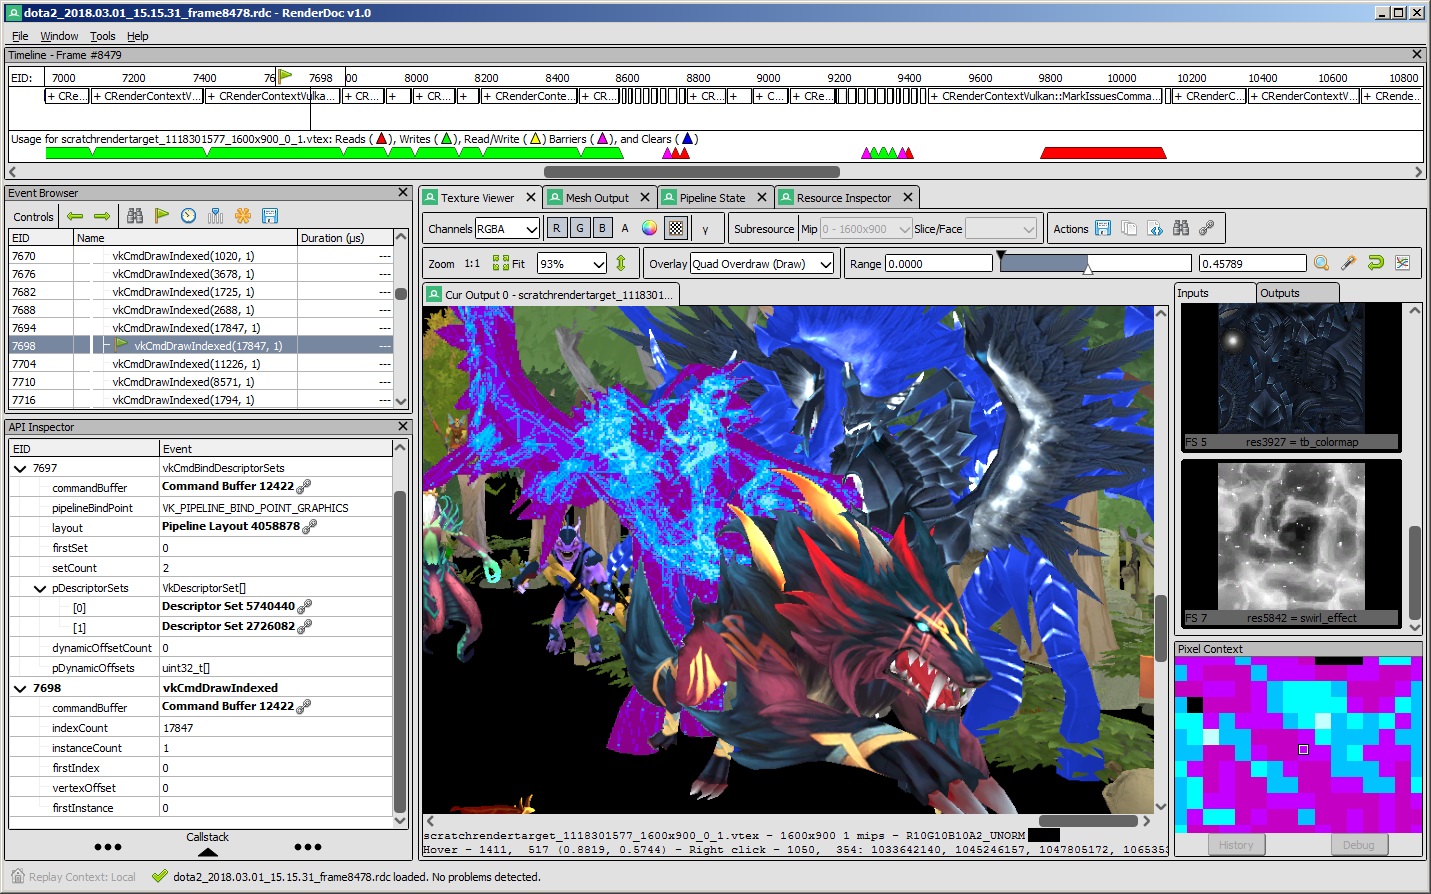
One of the best debugging tools is RenderDoc. It’s easy to integrate into your application or attach to an existing one, and it provides all the necessary features to debug a frame, including a solid shader debugger. It works on Windows, Linux, Android and Switch with any supported graphics API and is fully open source!
Additionally, RenderDoc allows you to capture timings for specific rendering passes, though these timings may not be as precise as those obtained from a dedicated profiler made by GPU vendors.
PIX
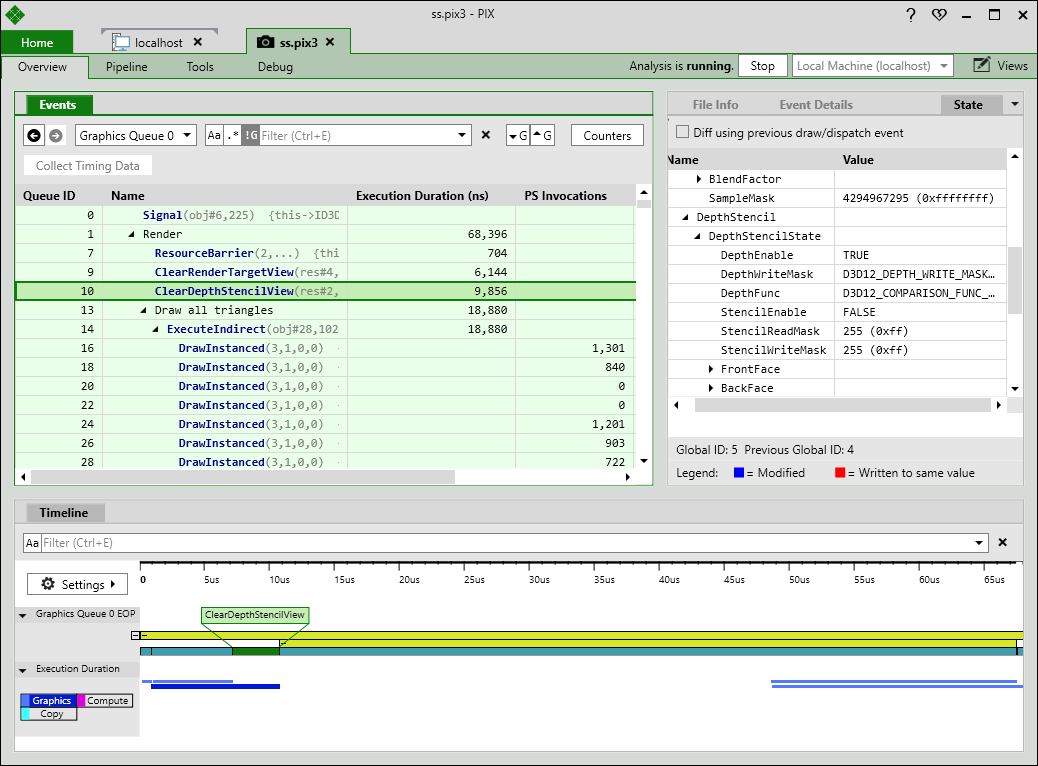
PIX is another powerful debugging tool, but it’s only available for Windows and XboX. One of its key advantages is that it stays up to date with the latest DirectX features, making it the go-to tool if you’re experimenting with new DirectX capabilities. Additionally, PIX can profile and analyze the performance of your application, helping you optimize your code.
GPA
The Graphics Performance Analyzers (GPA) from Intel is a graphics debugger and profiler. It works best if you have an Intel GPU but most of it’s features are still available with other GPU brands. GPA is particularly useful for identifying bottlenecks as it offers the possibility to do quick experiments like reducing the fill rate, reducing fragment shader invocation, etc.
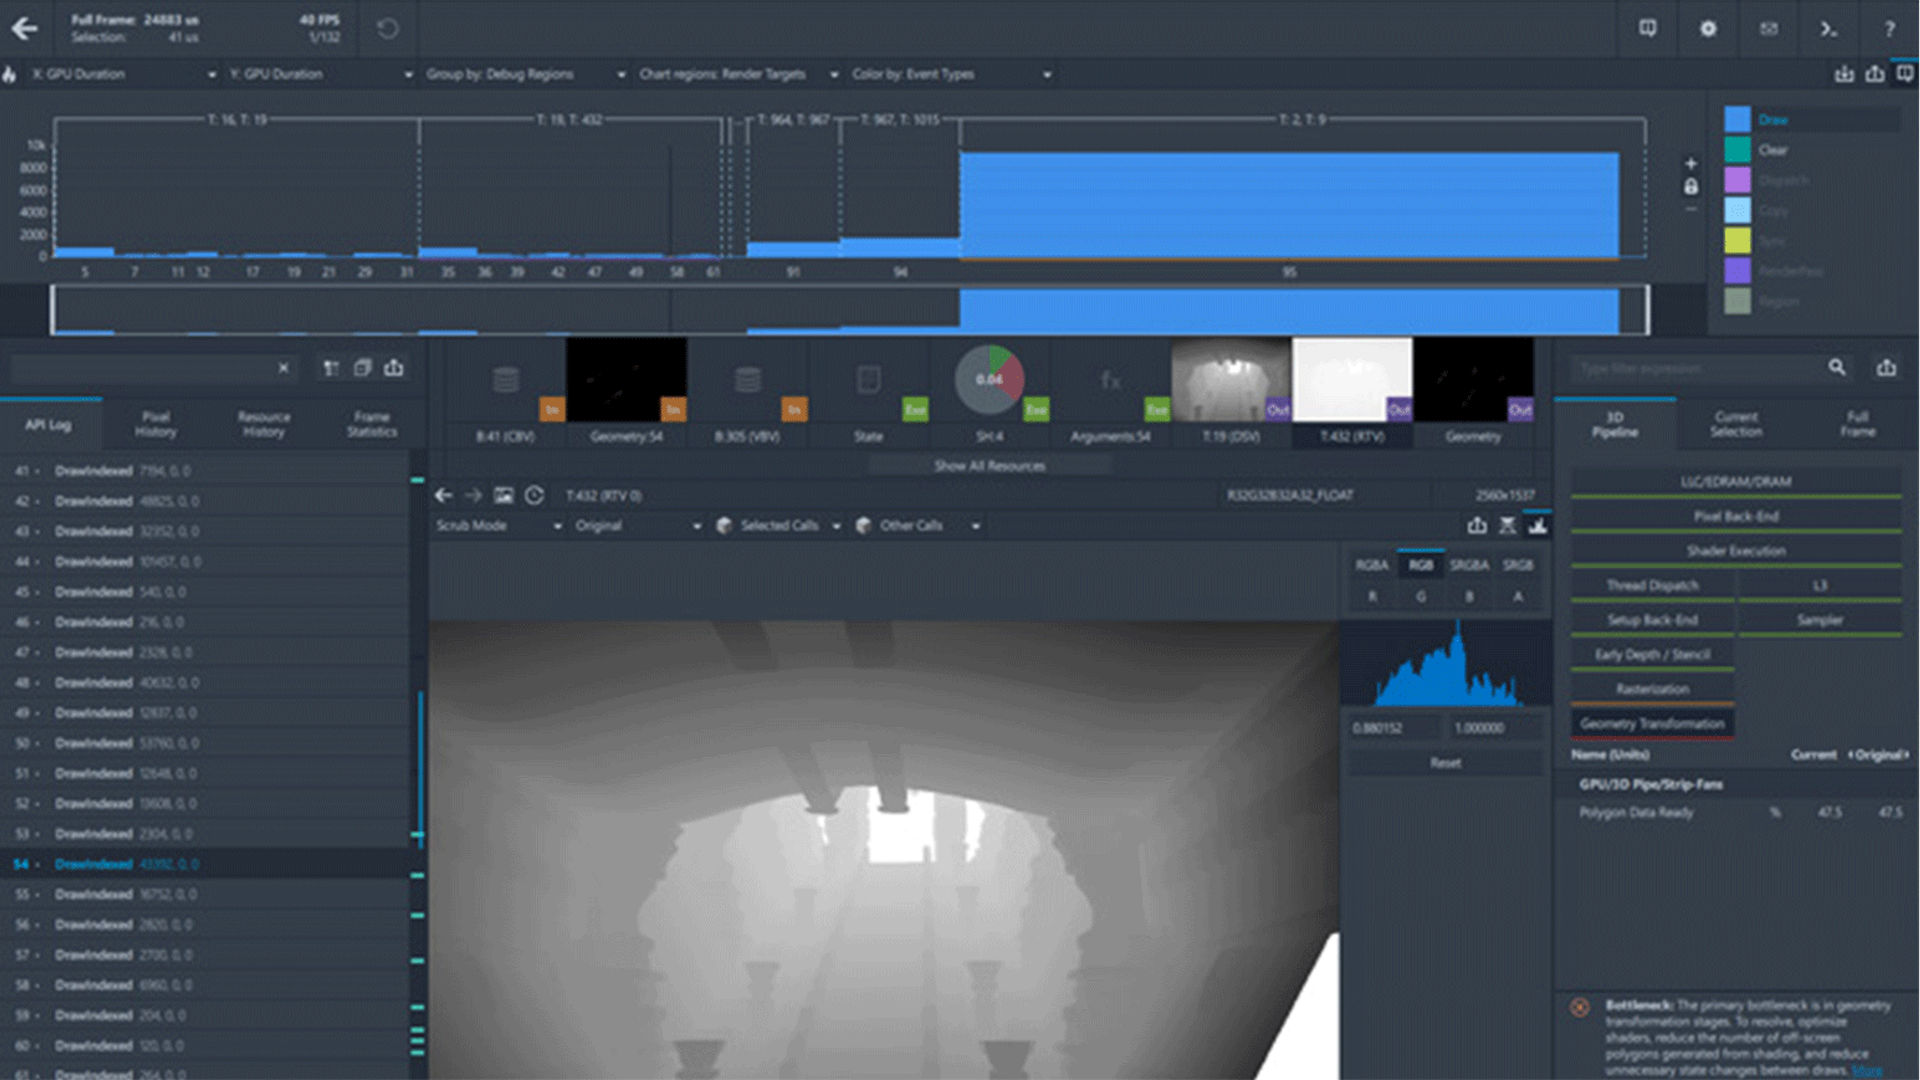
NSight Graphics

NSight Graphics is another useful tool for graphics debugging and performance analysis, specifically designed for NVIDIA GPUs. It provides detailed insights into your application’s rendering pipeline, allowing you to capture and analyze frame data, debug shaders, and track GPU performance.
XCode Metal Debugger
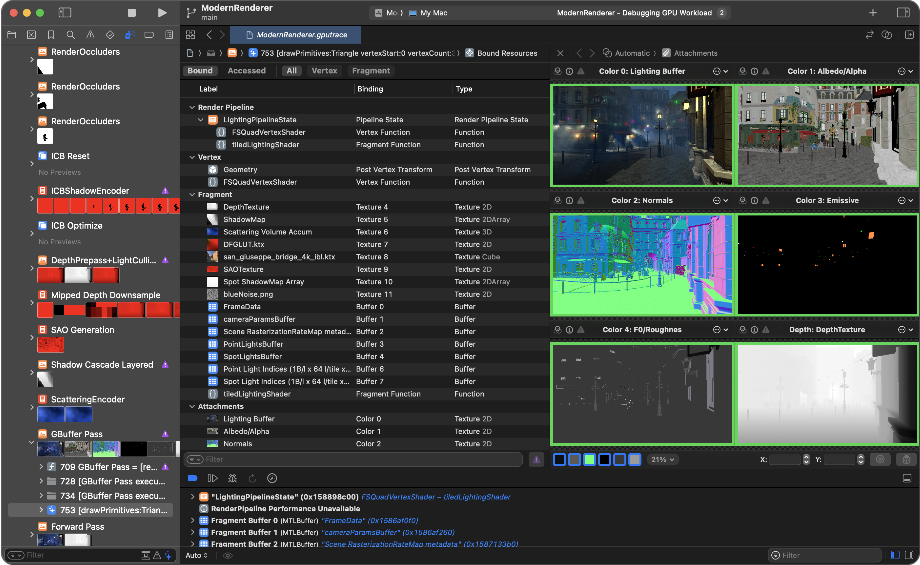
The Xcode Metal Debugger is a tool for debugging Metal applications on macOS and iOS. It provides a detailed view of how your shaders and GPU commands are executed, allowing you to step through each operation and inspect resource states. It also includes an easy-to-use profiler that helps identify GPU bottlenecks in your application.
GPU Reshape

The GPU Reshape IDE and debugger is a specialized tool for developing and debugging GPU applications. It provides unique features such as real-time out-of-bounds access detection, descriptor validation, resource initialization validation, and more. However, it’s worth noting that these features are only available when using an AMD GPU.
GPU View
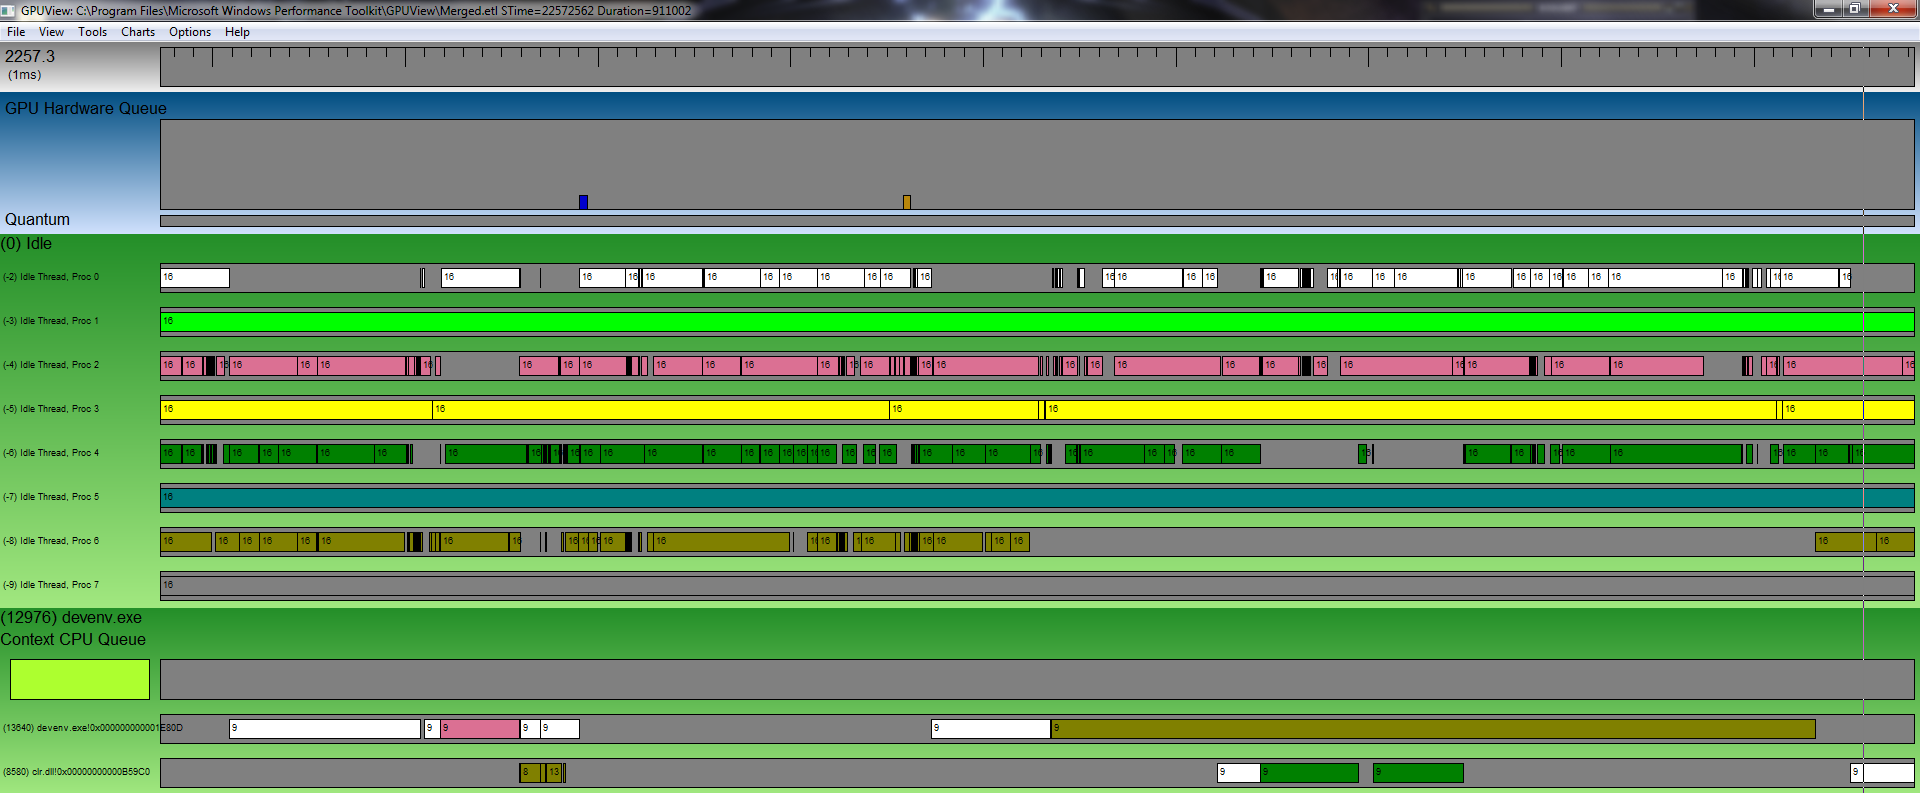
GPU View is a performance analysis tool designed for visualizing and debugging GPU workloads on Windows. It is a bit more cryptic than regular graphics debuggers but provides a complete view on the workload of the GPU. It can help track issues with VSync or detect other application that stall your GPU or interrupt the workload of another program and more.
Radeon Developer Tool Suite
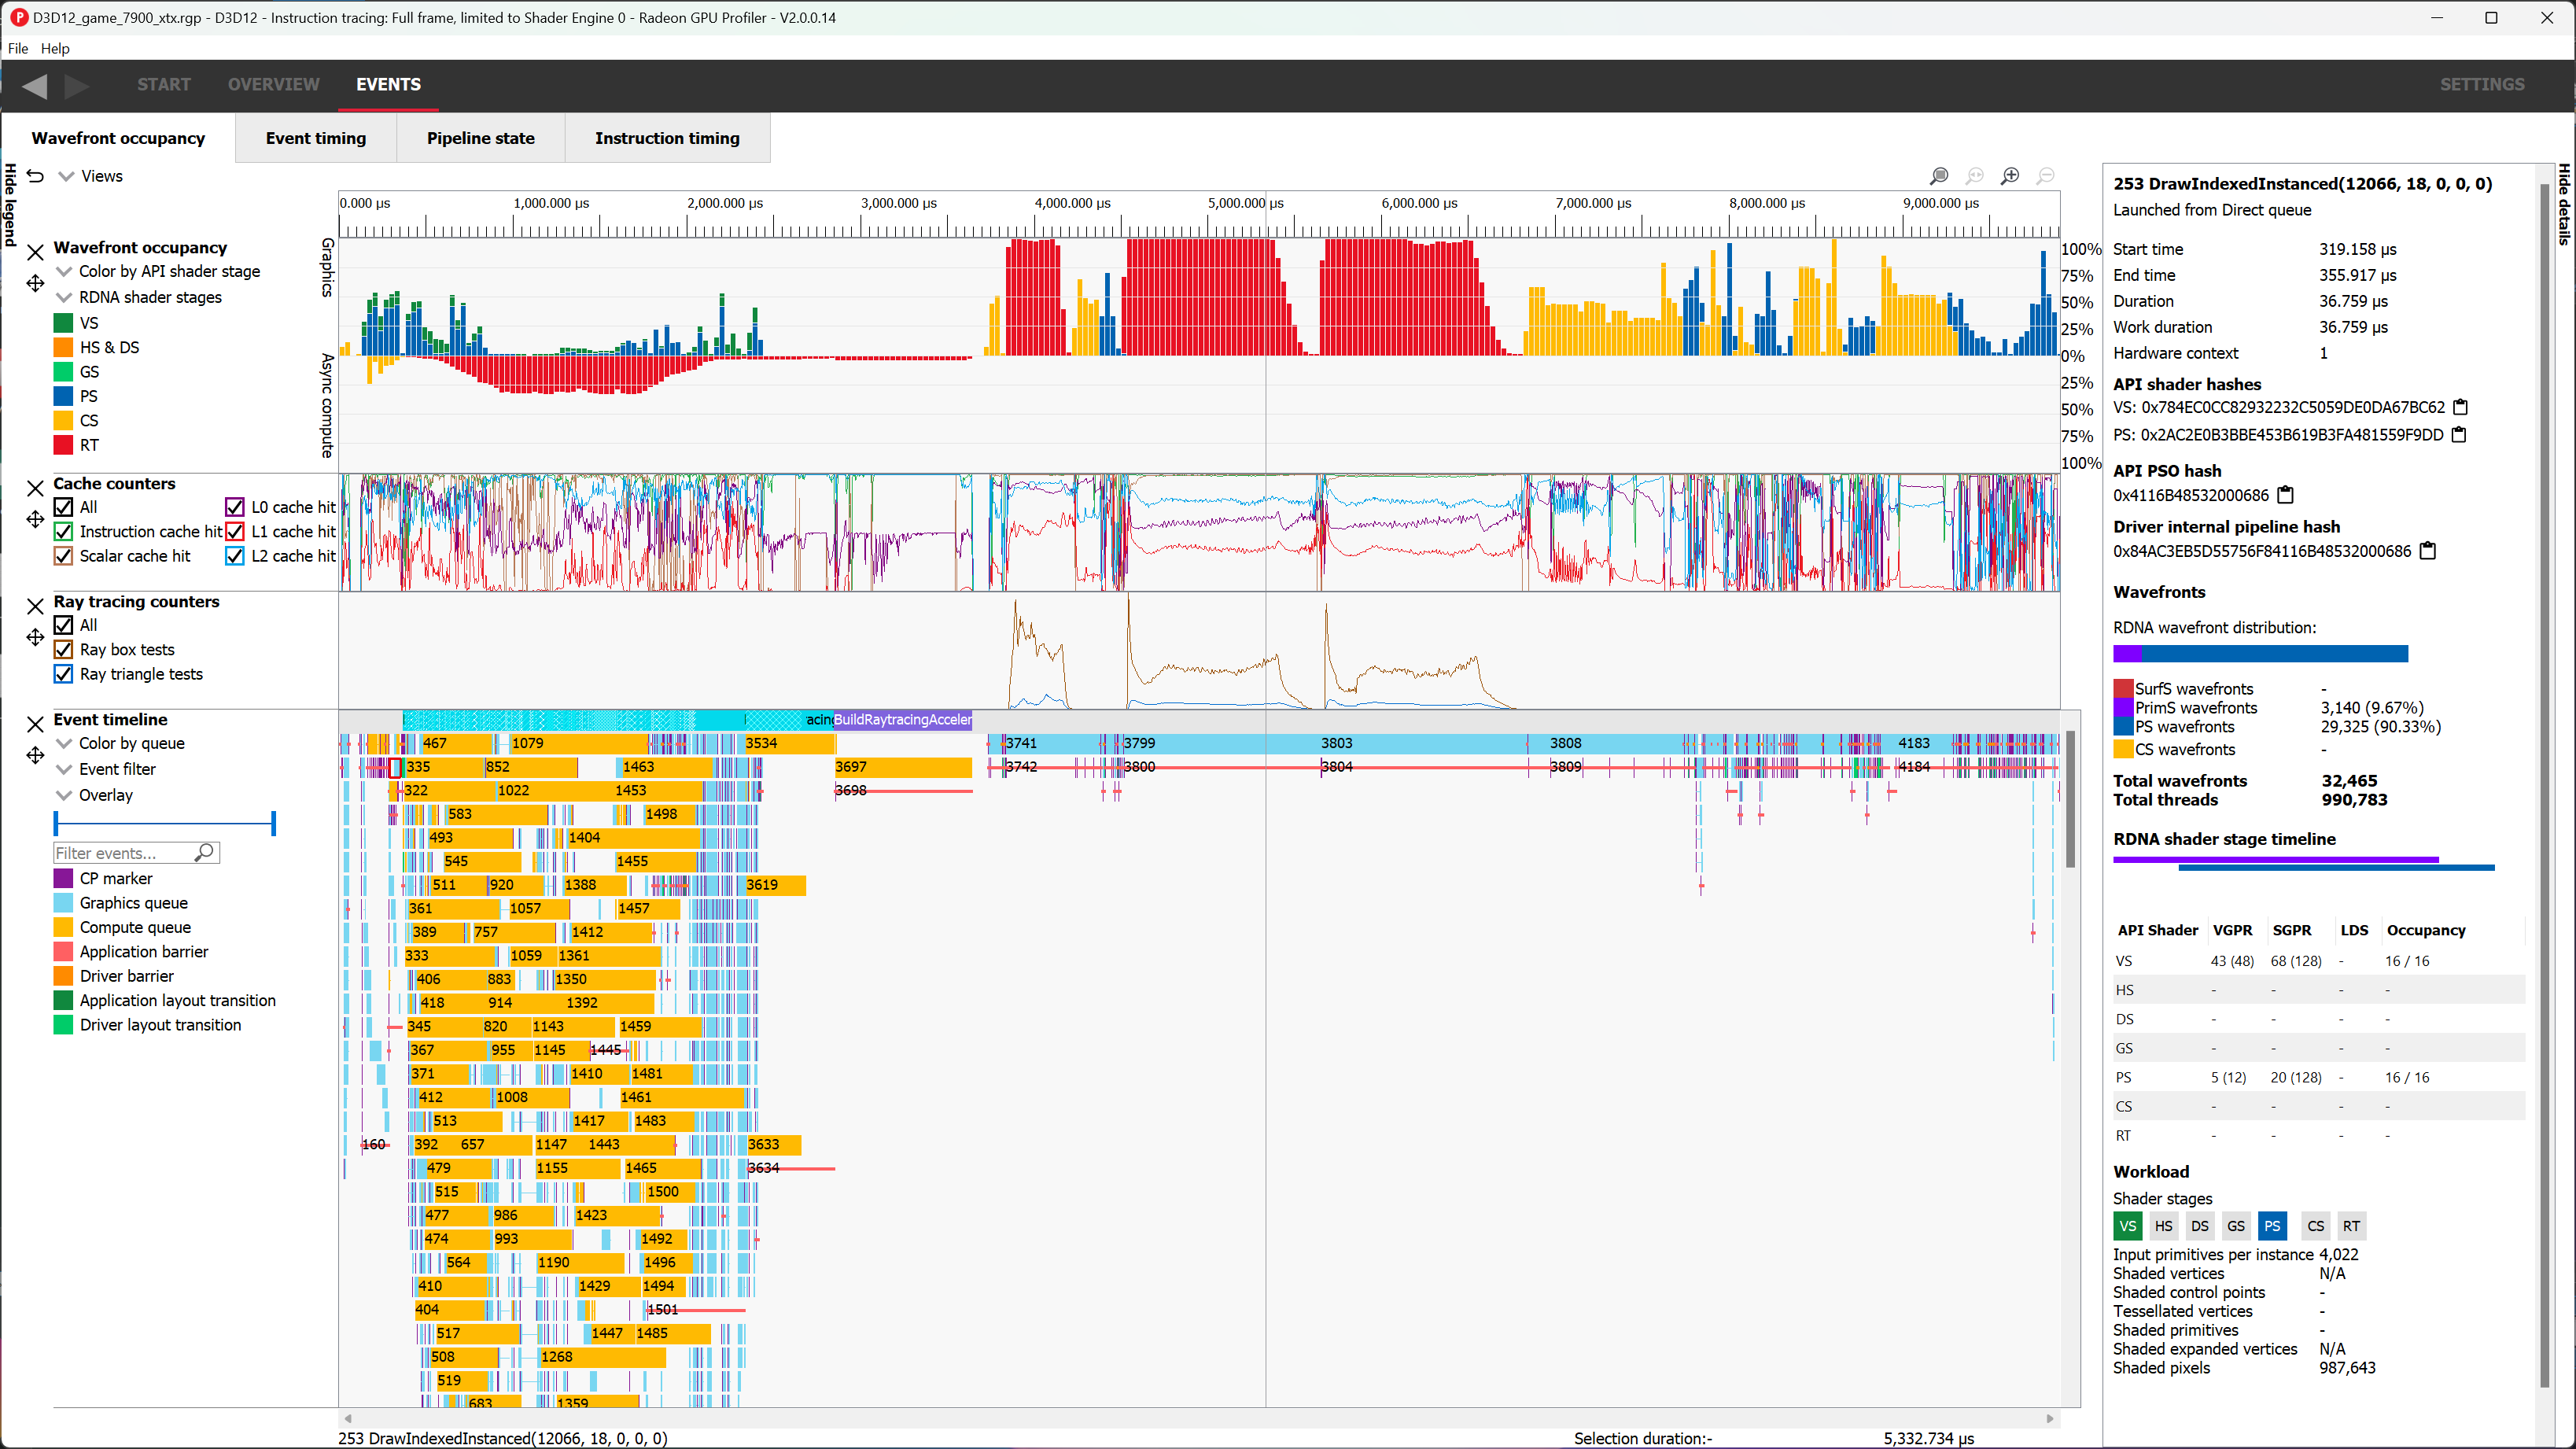
The Radeon Developer Tool Suite is a collection of profiling, debugging, and optimization tools for AMD GPUs. It includes utilities like Radeon GPU Profiler (RGP) for low-level performance analysis, Radeon Memory Visualizer (RMV) for tracking memory usage, and Radeon Raytracing Analyzer (RRA) for debugging ray tracing workloads. As long as you’re using an AMD GPU, this is a great suite of tool for debugging any kind of workload.
Validation layers
While technically not a tool but rather a feature of the graphics API, validation layers are additional checks that, when enabled, catch and report errors before they are sent to the GPU. They are useful for detecting issues in the setup and order of GPU commands. Each modern graphics API provides its own validation layer:
GPU Crash Investigation
There will come a time when your screen goes black or freezes, and you’ll need to figure out why. GPU crashes, driver resets, or GPU hangs can occur when a misconfigured workload is sent to the GPU, causing it to crash or stall. To identify the root cause, several tools can be used, including:
- 📄 FidelityFX Breadcrumbs and Radeon GPU Detective for AMD hardware.
- 📄 NSight Aftermath for NVIDIA hardware.
- 📄 DRED for DirectX 12 applications.
- 🎥 Aftermath: Advances in GPU Crash Debugging - NVIDIA Game Developer